UX Design for Industrial Machine Visit & Reporting System (B2B)
UX Design for Industrial Machine Visit & Reporting System (B2B) (Client: A global textile machinery manufacturer) In this project, I mainly worked on the UX side, focusing on simplifying a very complicated physical workflow used by the client’s field employees. Their on-ground team regularly visits different manufacturing units to inspect large textile machines. Earlier, all details were written manually on paper—company name, unit visited, unit head, the type of product the unit was making (jeans, shirts, etc.), fibre details, machine make, model, and many technical parameters.
Year
2024
Service
UX Flow
Category
UI/UX
Tool
Figma

Detail | Description |
|---|---|
Client | A Leading Global Textile Machinery Manufacturer |
My Role | UI/UX Designer (Primary focus on UX Strategy and Information Architecture) |
Timeline | 8 Weeks |
Platform | B2B Web Application (Internal Tool for Field Technicians and Management) |
The Goal | To replace a cumbersome, paper-based field visit reporting system with an efficient, digital platform to reduce manual data entry and improve reporting accuracy. |
The Problem:
The client's field service technicians relied entirely on physical paper forms during machine site visits. This manual process led to several critical inefficiencies:
Time Sink: Technicians spent significant time manually writing redundant details (Company Name, Unit Address, Machine Make/Model).
Data Inconsistency: Manual input led to spelling errors and inconsistent data, complicating final reports.
Slow Reporting: Paper forms needed to be physically returned or manually transcribed before reports could be generated, delaying managerial insights (KPIs).
Complex Flow: The required data entry was deep and hierarchical (e.g., Selecting a Company dictated available Units, which dictated available Machines).
The UX Solution: Data-Driven User Flows
My core contribution was designing the underlying User Flow and Information Architecture (IA) to transform the manual, repetitive process into a fast, guided digital experience.
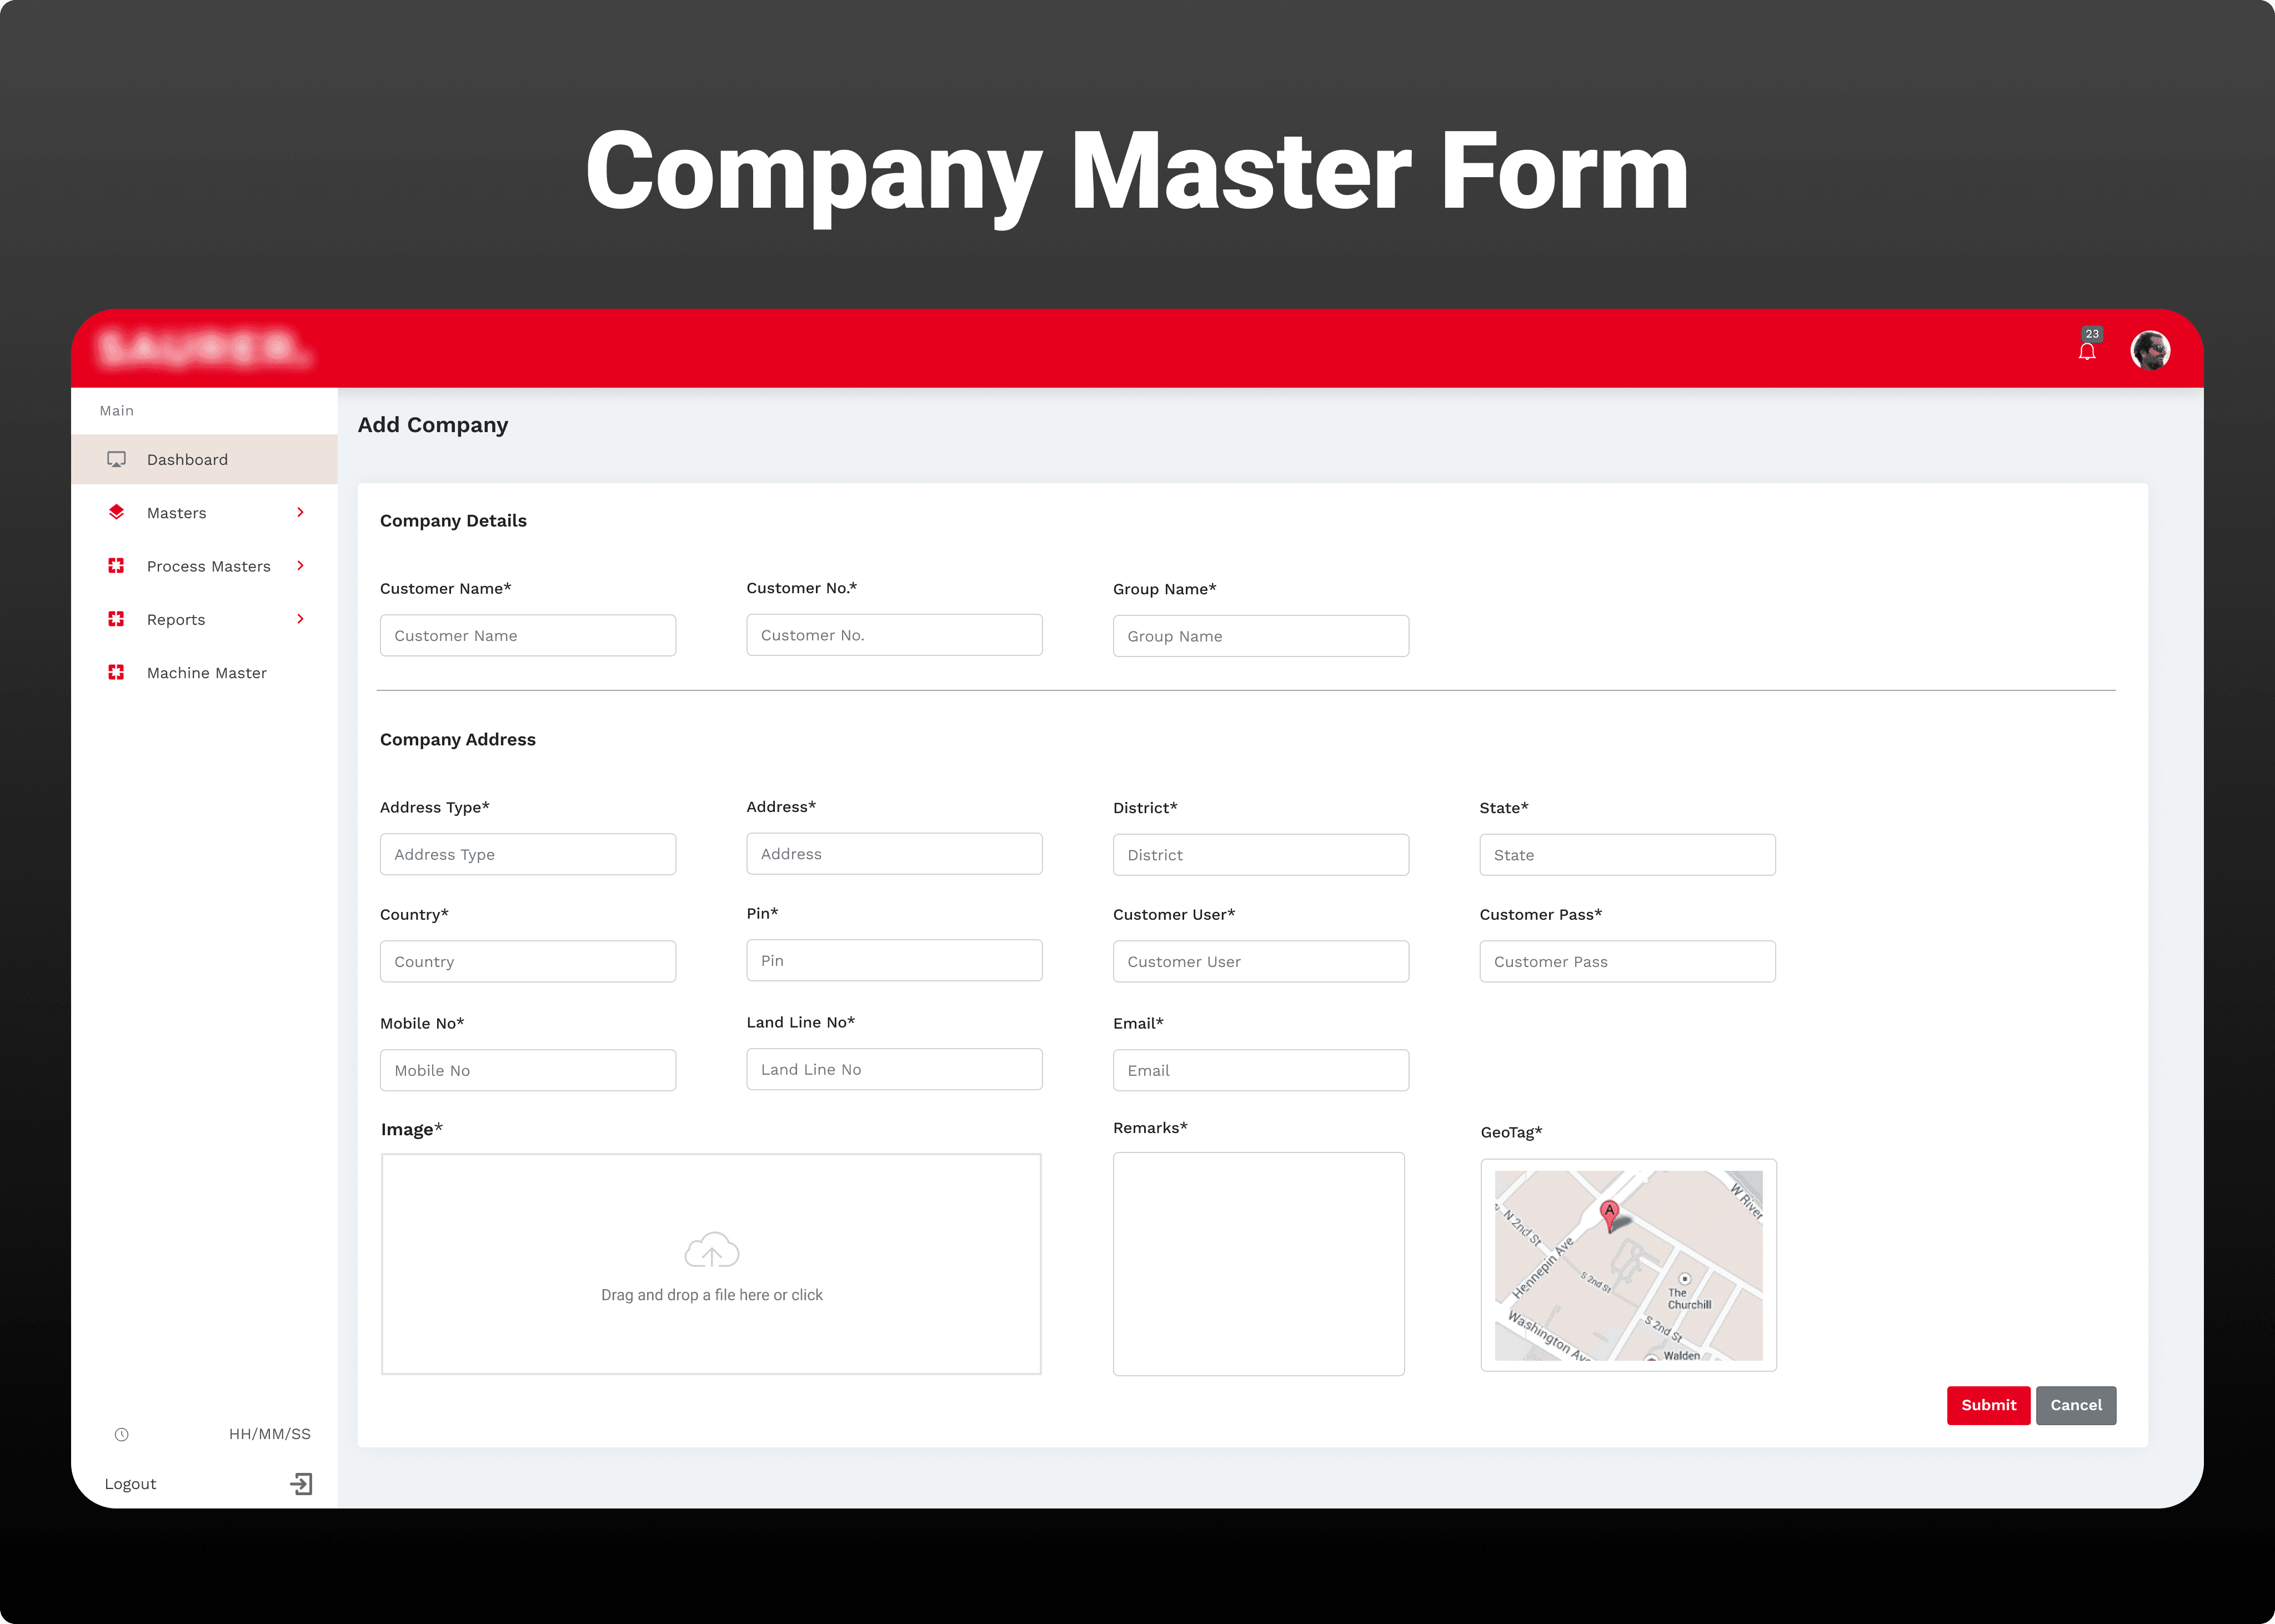
A. Strategic Use of Master Data
The key insight was minimizing technician input by pre-loading and linking all possible data points. This involved designing the flow around a set of "Masters" (pre-loaded data tables).
Original Paper Step | Digital Master Solution (UX Flow) | User Benefit |
|---|---|---|
Manually writing Company Name and Unit Address | Selecting from a Company Master (dropdown) which dynamically filters the Unit Master. | Eliminates spelling errors and saves writing time. |
Manually writing Machine Make, Model, Type, and Base details (as shown in image) | The system uses the selected Unit to dynamically display only the relevant Machine Master entries associated with that Unit. | Reduces the choice set, guiding the user quickly to the correct equipment record. |
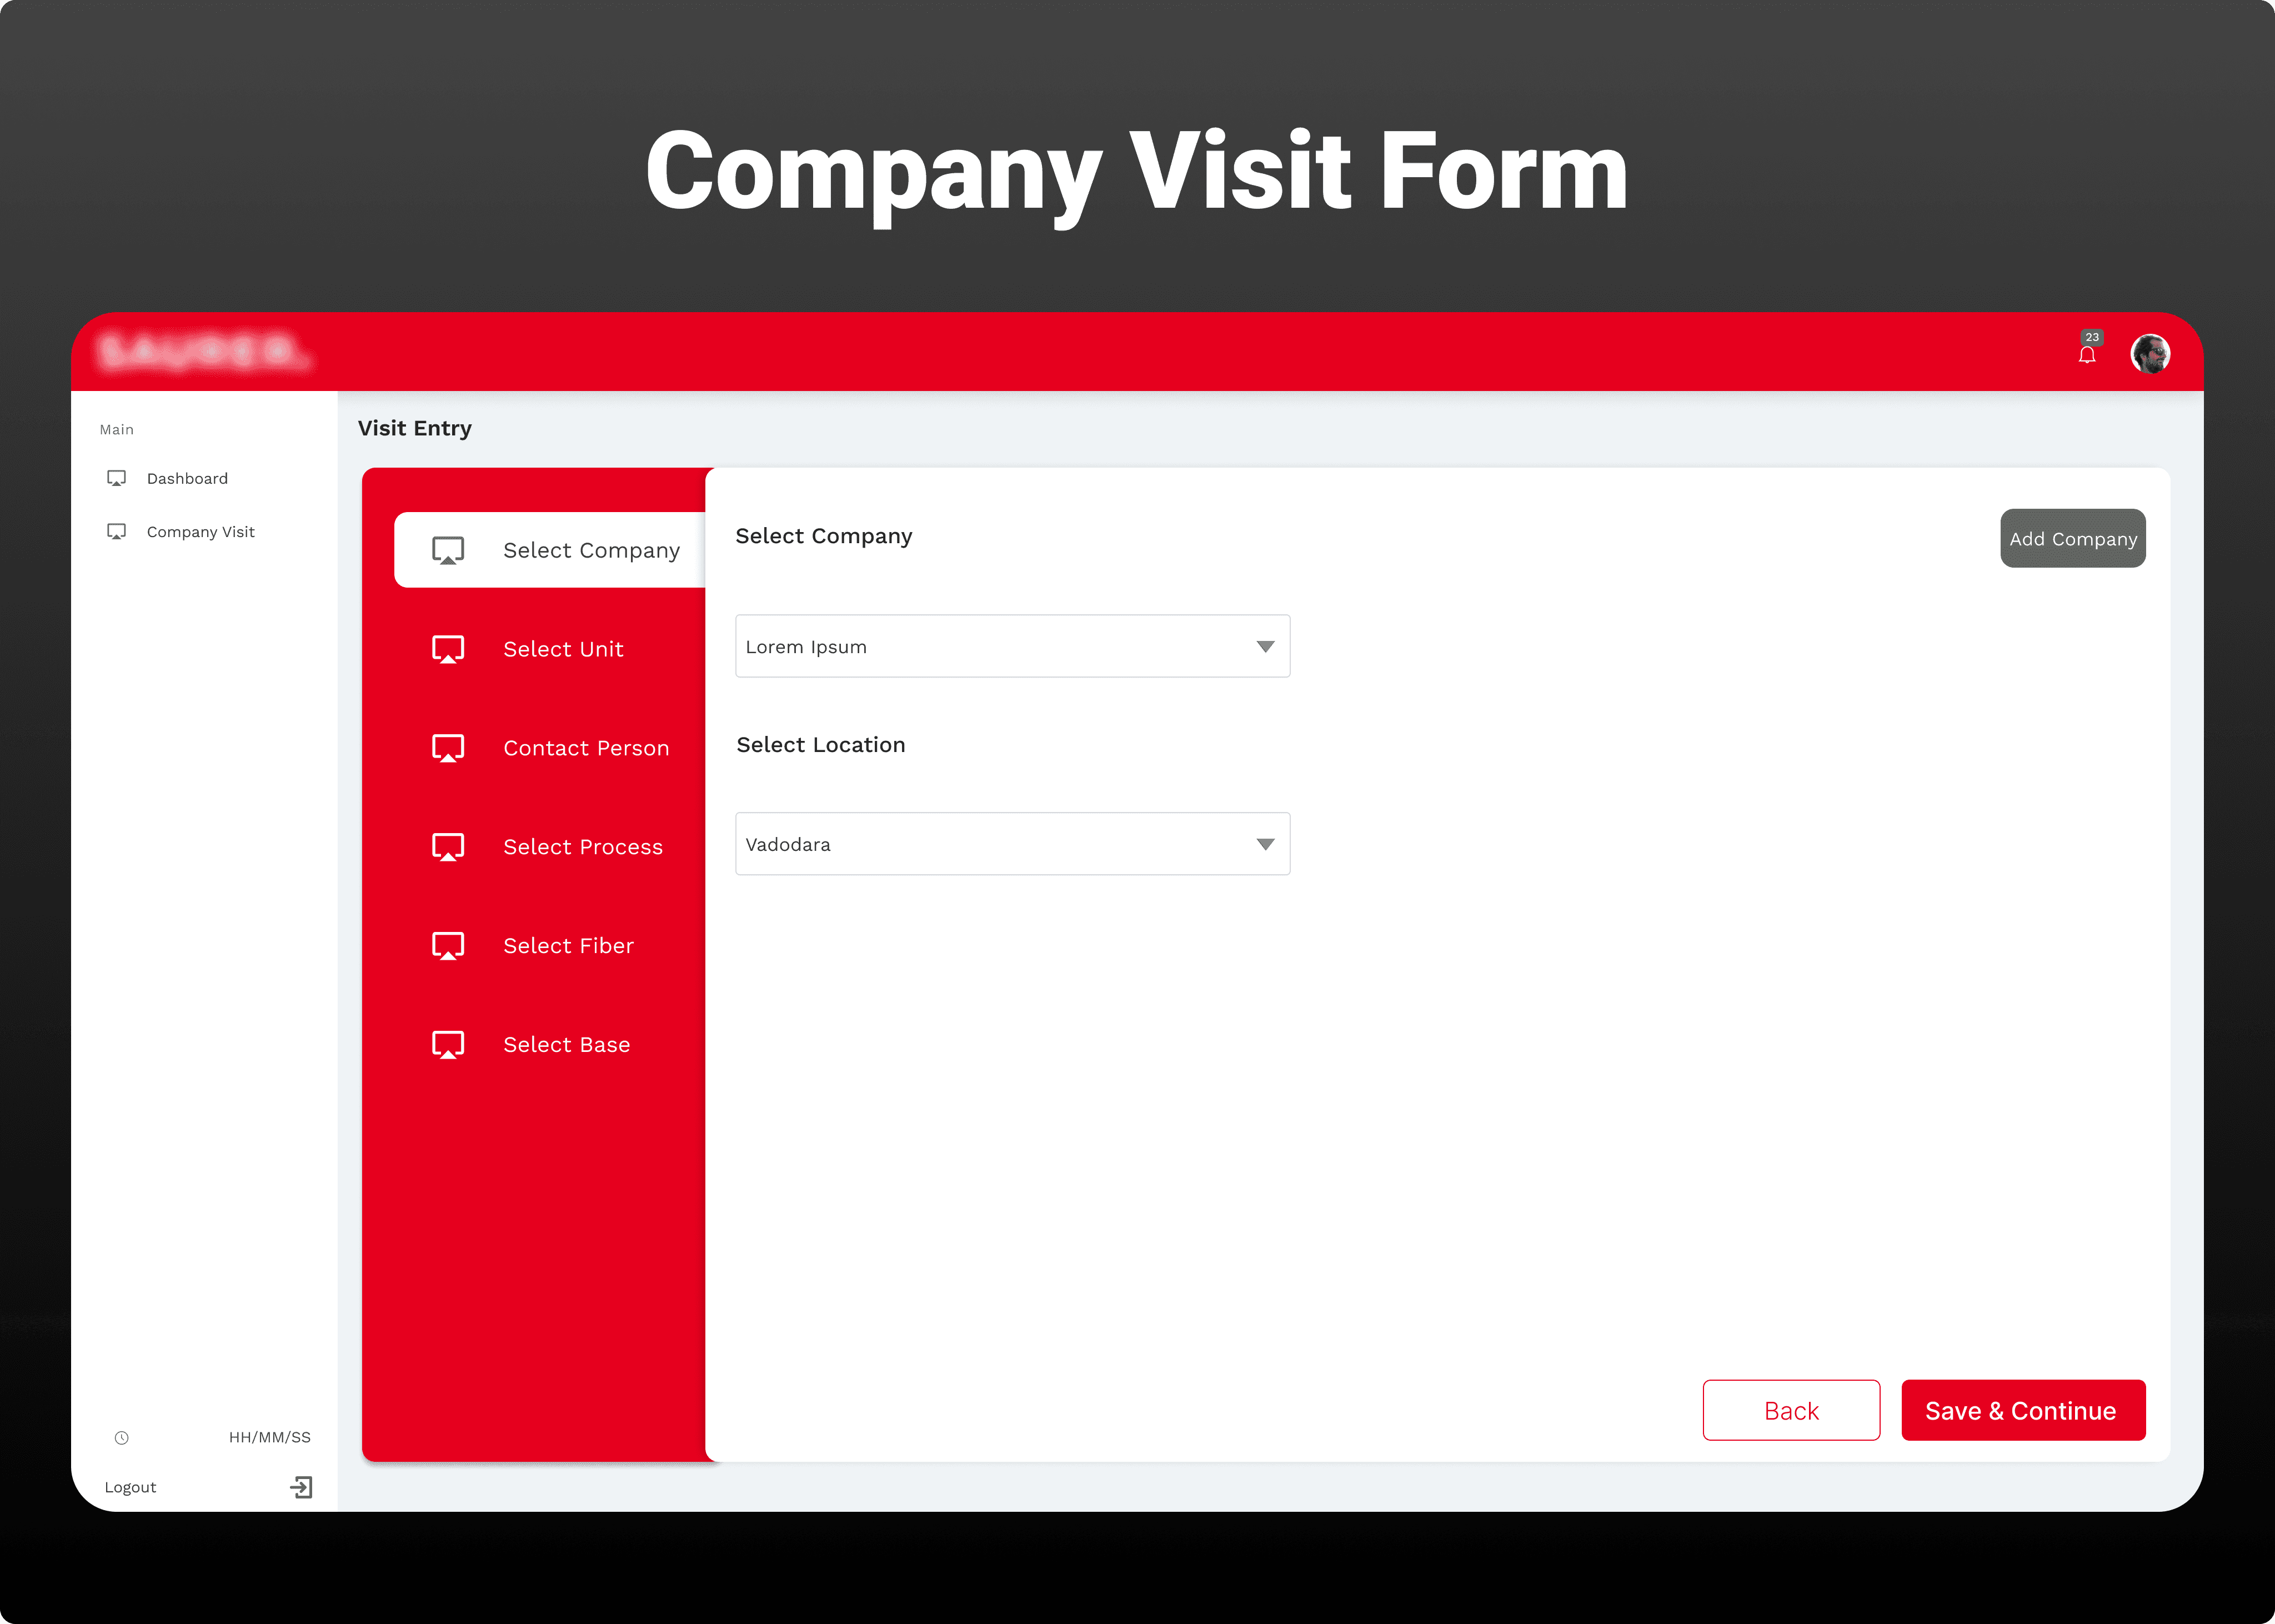
B. Designing the Core Visit Entry Flow
I mapped out the technician's journey to ensure a logical and efficient progression, moving from high-level context to specific operational details.
Step 1: Context Selection: Technician selects the Company -> Unit -> Contact Person.
Step 2: Operational Focus: Technician selects the Process (e.g., Denim, Spun Yarn) -> Fiber Type (e.g., Cotton, Polyester).
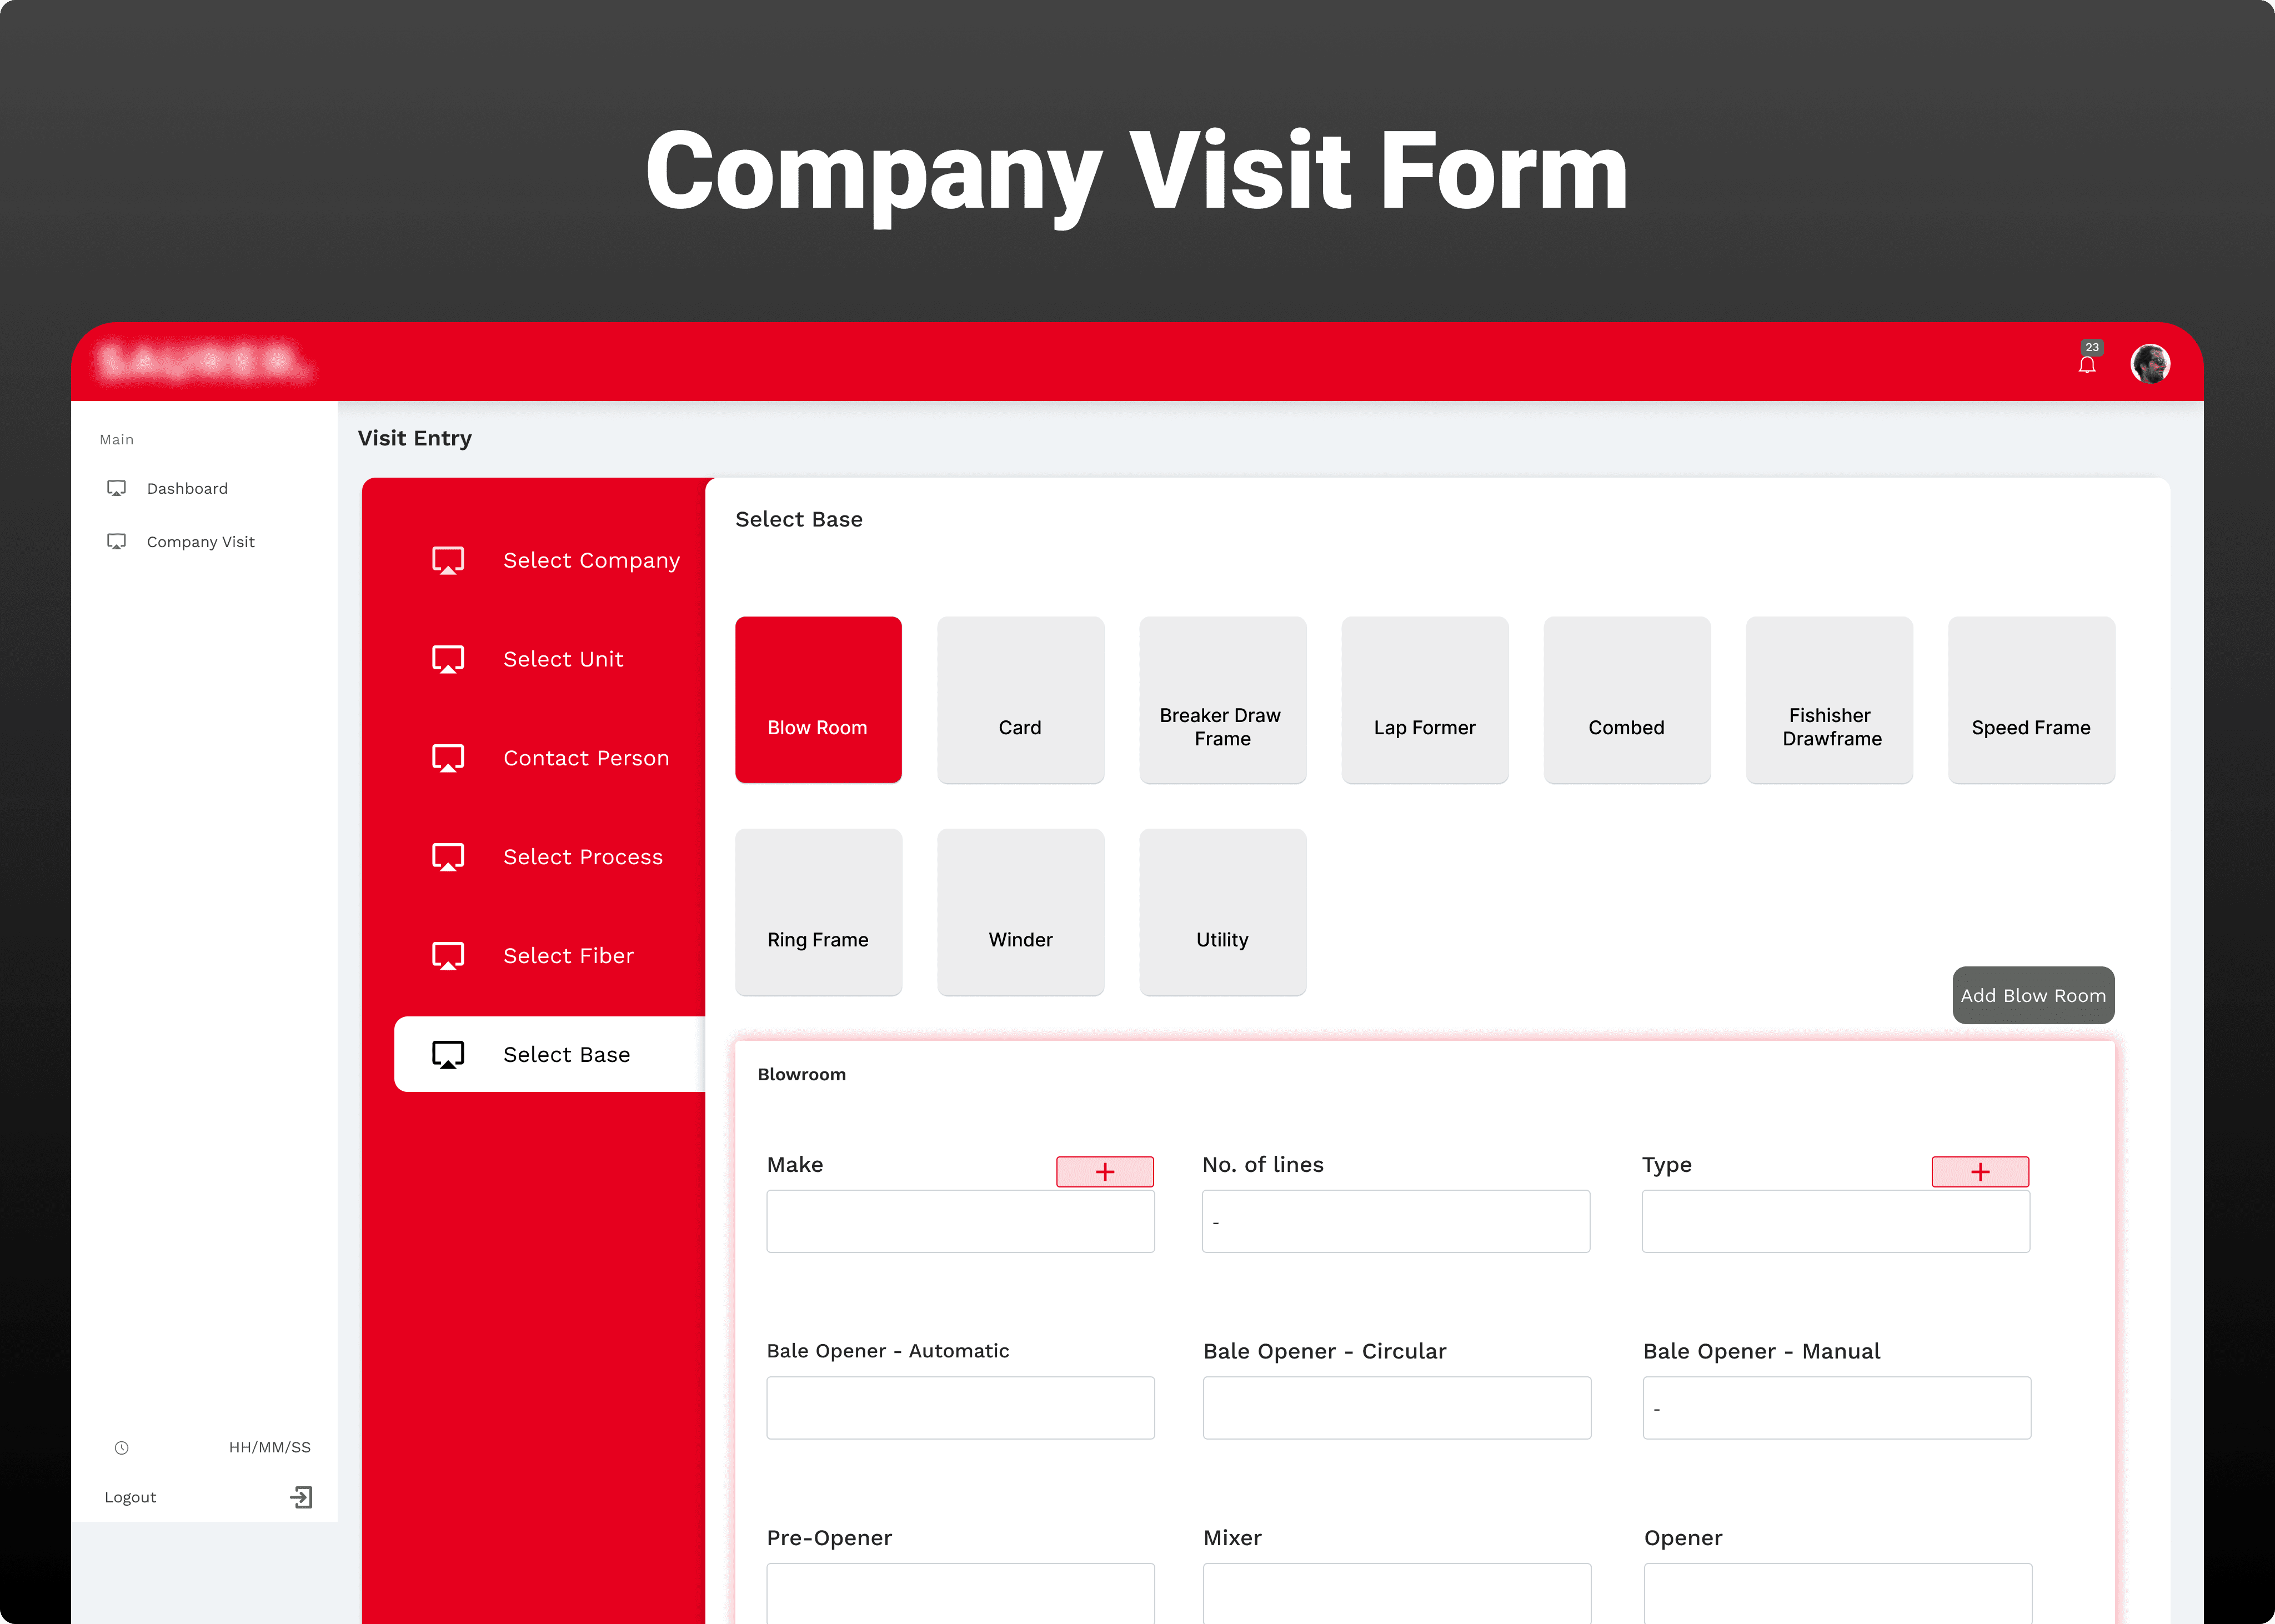
Step 3: Machine Detail Entry: Technician selects the Machine (Make, Model) and fills out the technical details (replacing the manual Base selection).
Step 4: Summary & Submission: Review and final submission.
UI Design & Roles (Information Hierarchy)
Under the project manager's guidance, I designed the initial dashboard focusing on simplicity and brand alignment (Red/White palette).
Dashboard UI (Landing Page): Focused on immediate value, featuring key metrics (KPIs) and quick links to the most frequent tasks (Visit Entry) and configuration pages (Masters).
Role-Based Access (IA Decision):
Technician Role: Only sees the Visit Entry section to add new reports.
Management Role: Has access to the Reports section to view, filter, and analyze the data entered by the technicians (e.g., Total Visits, Visit Status KPIs). This ensured that data was only visible to those who needed it for decision-making.
Outcomes & Impact
By streamlining the process through robust Information Architecture and guided selection flows, the new digital system achieved the following:
Increased Efficiency: Reduced the time technicians spent on form-filling by an estimated 80%.
Improved Data Quality: Minimized manual entry errors through the use of linked Master Data, providing cleaner data for management reporting.
Faster Insights: Enabled management to see real-time visit status and generate accurate reports instantly, replacing a multi-day delay inherent in the paper system.